
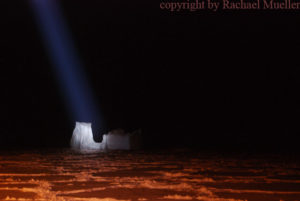
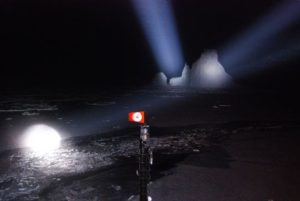
We were on station when I woke up this morning. I pulled back my curtains to the see orange sea ice reflecting the lights of the ship and a steel blue spotlight piercing the darkness overhead to illuminate an iceberg that was off the aft port quarter. On deck, I saw other spotlights illuminating icebergs off the starboard and port bow. Although we were surrounded by sea ice, the ship had etched out a “pond” of water on the starboard side into which the wire for the CTD disappeared.
The bustle of activity in the Dry Lab ushered me quickly into my watch. For the next eight hours or so, the N.B. Palmer stayed stationary with respect to the sea ice, and we took a CTD every half hour with four minutes in between drops and a half hour break every six casts. We were using the Niskin rosette only for the instrument measurements (e.g. temperature and salinity) and not water samples, so we didn’t even bother to bring the rosette on board in between drops. Instead, we just watched the stratification unfold on our monitors, cast after cast.
Once a rhythm was established, Victor, Michael and I could take turns focusing on the monitors, reading or taking care of personal business. I became intrigued by a book that floating around the Dry Lab for a couple of days; “Atmospheric Halos” by Walter Tape was sitting in front of me with a sticky note on the cover that read, “In case you’d like to know what causes it.” I thought, “indeed!” and I started flipping through the book.
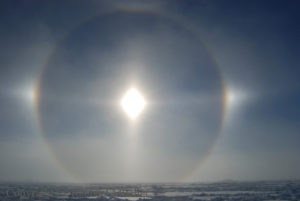
The sun halo that I had seen off the port side just a couple days ago was still fresh in my mind. I had taken photos of the halo from off the port bow and jotted down some notes when I returned inside. My summary reads: “-19.8 °C with -44.6 °C wind chill….ice particles seem to be blowing low to the ground and [the light appears to be] refracting through these lower level particles.” It was a beautiful sight! Rainbows and halos arced around and through the sun in a way similar to what I had seen before, but I had only ever seen this effect with a veil of cirrus clouds in the upper atmosphere, not by crystals that were blowing relatively close above my head and that only took a change in wind to destroy the effect.
The first few pages of the book revealed that sun Halos can be seen anywhere but that they are more common in Antarctica because the ice crystals that cause the sun halos are in both the upper and lower atmosphere, whereas other places just have the ice crystals in the upper atmosphere. The particular type of halo that we saw was a Parhelia with a Circumzenith Arc. The Parhelia arcs through the center of the sun and creates brighter spots (Sundogs) when it intersects with a halo that goes all the way around the sun at a distance of 22° (aka 22° halo). The Circumzenith Arc is an upward facing arc that sits at the top of the sun encircling halo. I also read that white then the light is most likely reflecting off the crystal surfaces; whereas rainbow halos indicate that the light is refracting through the ice prisms, which are either hexagon plates or hexagon columns. It is amazing how many different kinds of halos can be born from the different kinds of crystals! The plate-type halos are most common but crystal size, orientation, quality and type all effect the type of halos that one can see.
As I scanned the book, I couldn’t help but recall the halo that my husband and I had seen last winter in the Cascades. It was a beautiful blue sky ski day, with cirrus clouds above. Without sunglasses, I had looked up to see an amazing halo around the sun that had six to eight Circumzenith Arcs symmetrically lining the halo. At that point, I had never seen one Circumzenith Arc, let alone a few on one halo! We were still at the trailhead to our cross country route and I was surprised that nobody else seemed to take notice or care except for my husband and me. I now wonder how common that type of halo is as it wasn’t sketched out in Walter Tape’s book.
In any case, as I flipped through the book, my mind returned from halos to take notes on the CTD cast and to watch the monitors. Before too long it was 8:20am, and we were doing our last CTD cast of the station. Typically when the CTD returns from depth, the profiles from the down cast and the up cast line up fairly well. For the first half of the up cast, the two profiles matched nearly identically; but in the middle of the profile, temperature started to quickly depart from the downcast values with a difference of around .5 °C, at the same depth. Changes in both salinity and oxygen followed suit. It seemed that the CTD was passing through a layer with distinctly different temperature, salinity and oxygen, to a degree that I hadn’t seen before. I alerted Stan and Bruce, and we followed up with another CTD (after emptying the water samples that we had taken for this last cast); unfortunately, by the time the next CTD passed through the layer, the water column was different and the feature was gone.
Michael and I had a long conversation afterwards about whether the measurement was real or instrumental. The up cast data is notorious for not being as accurate as the down cast because of the way in which water enters the instruments. Yet, at what point does one consider observed changes to be greater than the possible instrument error? Were we witnessing a rare mixing event in the ocean, did the ship simply drift into a new water mass, or were we simply seeing an up cast measurement flaw? Even though I am still convinced that the data may show an interesting mixing event, Michael helped me gain a healthy dose of skepticism for that interpretation. I suppose that I am doing a good job of filling the role of the young scientist who is easily excited; at the very least, good discussions have come of it!
Onward and upward,
Rachael