The days pass quickly when you’re working a twelve hour shift that is filled with exploring the oceans. I feel like a just wrote yesterday, but I know that the reality is more on the order of a few days. With all that is going on, I could easily put this update off for a couple more days, but I am determined to send a quick note. There is already so much to say! The juicy science explanations will have to wait for when my brain is a bit more rested but here is a simple update to tie you over.
As I mentioned in my last posting, we retreated from the mooring and CTD stations at Cape Adaire with the encouragement of stormy seas. The ocean yielded to the persistent wind, and the wave height continued to increase. Before too long, the N.B. Palmer was punching through waves of up to thirty-five feet. In the exercise room, the feet of my stationary bike would occasionally lift up, and I would tilt ever so slightly as if banking around a corner of a road. Needless to say, sampling stations were put on hold. Many people didn’t fare too well in the rough seas, and the ship become somewhat of a ghost town—particularly the galley! Although my own stomach felt fine, I was still glad when we returned to the area around Ross Island (on which McMurdo station is based) and the skies became sunny, making the fresh, two-inch coating of ice sparkle on deck. We have since been sampling non-stop.
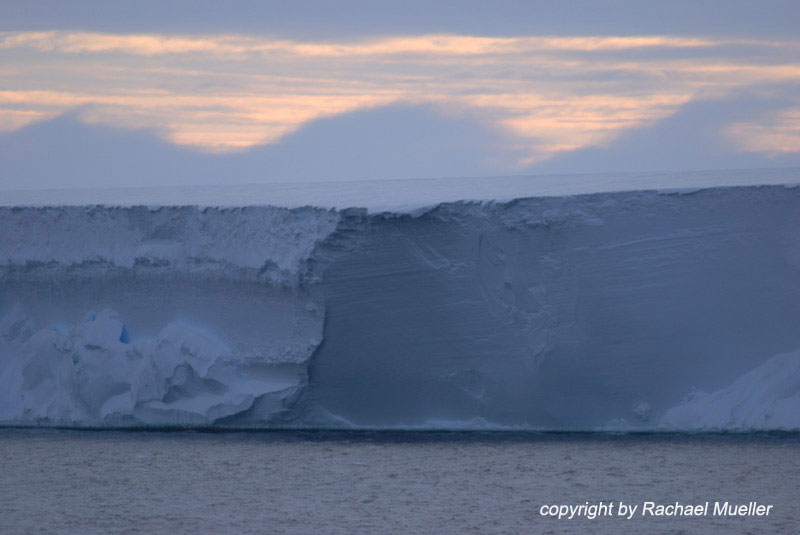
Our cruise track is taking us along the front of the Ross Ice Shelf, a towering wall of compacted snow that ranges from about 60 to 100 ft. above sea level; we are dwarfed in its shadow. But 90% of the ice is underwater, so the ice is really about 600-1000 feet thick! It has been our starboard company since rounding Ross Island’s spectacular Terra Nova mountain, which was also basking in the welcomed sunshine. Our samples are taking us right up next to the ice shelf, as close as 0.1 miles. Ice is truly breathtaking in its beauty and color, and when I’m not busy with science I’m enjoying its company. But what I appreciate the most about this floating laboratory is the ability to experience the beauty and the science of processes that I have mainly learned of in theory.
Yesterday, for example, I visited the bridge in between CTD stations to witness a cloud formation over the ice shelf. Clouds are great tracers of atmospheric circulation and, because air is a fluid medium (even though it is much less dense than water), the atmosphere and oceans tend to share similar behavior—including types of instabilities. To familiarize yourself with my use of the term “instability”, think of any situation that might make things mix together. For example, if you put fresh water on top of salty water (which is much denser) then the fresh water simply floats there. But, if you try to put the salty water on top of the fresh water, the salty water will want to sink. As it does so, some of the salty water will mix with the fresh water to create some water that has intermediate saltiness. More complex types of instabilities are caused by changes in motion, including the one I saw (see photo), which is called a Kelvin-Helmholtz instability.
When an upper atmosphere layer is moving at a different speed from a lower atmosphere layer (and the right conditions exist), this change in wind speed can cause the air to roll up in a “billow” and mix like a crashing wave at the beach. If there are also clouds in the air layer then the rolling up can be seen by a cloud formation that looks very similar to breaking waves. My Master’s thesis advisor is an expert in this type of mixing, and I became familiar with it through him. As I watched the instability occur naturally, I was struck by its transient nature: the wave-like clouds were fleeting and only lasted around ten to twenty minutes.
I had a similar experience of witnessing theory in action when I came onto watch this morning: My watch started with a CTD cast, so I had the fortune of watching the water profile unfold as the CTD descended. Half way down the profile, I started getting excited; by the time the CTD reached the bottom, I was nearly jumping up and down, trying to convince my watch supervisors to add a few more stations to bracket the one we were at. On the screen in front of me were wave-like increases and decreases in temperature and salinity that, in tandem, seemed to indicate the type of mixing that I studied for my Master’s thesis (thermohaline interleaving). My watch supervisors were less impressed by the profile and were skeptical of my interpretation; but it was such an exciting moment to see evidence of something that I had only really studied in theory! Looking at the data more closely after the CTD station, I am now more skeptical of my earlier interpretation as well. The excitement, however, wasn’t wasted as it inspired Michael Schroeder to show me graphs of “real” interleaving in data that he had helped collect near an ice shelf in the Weddell Sea. Thus continues the learning and exploration.
In all this writing, I still haven’t found an excuse to mention the sampling excursion into a large crack (called a “rift”) in the ice shelf. We were surrounded on 3 sides by ice! This rift will eventually crack completely to form another tabular iceberg between the former locations of the well-publicized B-15 and C-19 bergs (this particular site is being studied by Dr. Doug MacAyeal). (For more on the Ross Ice Shelf icebergs, see the European Space Agency Envisat page, and the NSIDC icebergs page. Nor have I mentioned the party that we had (i.e., wearing colorful wigs) when we crossed the dateline (longitude 180).
We are currently motoring and CTDing towards the Bay of Whales (78°30’S 164°20’W) which is an indentation of the front of Ross Ice Shelf just north of Roosevelt Island. We’ll probably arrive there before you get this note. As I write from the bridge, snow is blanketing the ship while Snow Petrels encircle us and provide a stark white contrast to the grey skies and dark seas.
More science and stories to come. For now…much needed sleep!